Wednesday, October 28, 2020

Powering My Own Home

Have you ever looked at the electricity bill every month and wished that it would just disappear? Oh! How much easier the monthly budget would be to balance without that great big financial lump around your neck!

Well, last February I was chatting with a salesman from a local solar power company, mainly because a friend is literally building his own system, and I realised that with a little extra outlay I could have my own installed for me. So we did it!

So we arranged a deal with one of the local credit unions to loan me the money to buy the hardware and get it all installed, and the installers negotiated with Tacoma Power (the electricity provider) so that they would install a "net" meter (instead of a "one-way" meter that just measures what you're consuming), so that they could treat me as a supplier or a consumer. The installers arrived one rainy March day (poor guys !) and did the whole thing in about 5 hours - installed a framework onto the roof, installed the wiring for the panels down to the metering, and installed the panels themselves - all 32 of them (14 here and 18 on the other side - 32 in all)


So, the roof is producing (during the summer months) far more than I consume, so during the day I produce power and that's accepted by the Tacoma Power system and used to help supply other people on the electricity grid. During the night the roof is producing nothing, so I consume directly off the grid, just like everyone else. I could, I suppose, install a set of batteries to charge during the day and supply me during the night, but, aside from being costly, there's already no room in the basement !!
Today (2020.10.11) is a very rainy day, and my roof isn't seeing enough photons to be worth waking up for! So we're consuming as before, directly off the grid. Overall we were consuming between 600 kWhr and 800 kWhr ("kiloWatt-hours") every two-month billing period. That's dropped considerable over the last few months, but will go back up over the winter. However, Here in Tacoma the one major utility company supplies drinking water and electricity and also handles sewerage and run-off water, so from now on whatever I produce is set againat the aggregation of all these bills, so it isn't all that easy to see just what the benefit is without comparing things back to last year, but I have to say that things definitely are less expensive !

Well, it's now June 2021, so I can look back at how the roof is performing. The company that creates the systems (panels, metering, connections, etc) - Solar Edge - has a site that you can register on for your own installation and see how it's doing. 

As you can see, it came on-line in May 2020, peaked on July, and was still giving some useful output all the way through the winter. 

What does this mean to me in "real life" ?
Well, the public utility here in Tacoma, WA, takes care of  Waste, Water, and Electricity, so its bill for March and April 2021 looks like this:

Electricity-$50
Drinking Water$54
Waste Water$64
Solid Waste/Recycling$77
Surface Water$48

The installation is set up and wired such that the house consumes electricity from the roof first and only when house demand exceeds the roof production does it pull from the city grid. If the installation production exceeds house demand then the excess is exported to the city grid.
That entry for the Electricity indicates that my installation pushed back enough electricity during the days of March and April to be worth $50. For the two months it produced 1.986 MWh in total power, of which, per my bill, 1045 kWh were accepted back by the City. Comparing the difference with the 2020 consumption (pre-installation) of 800 kWh shows a small consumption increase, which we expected.

So, after having the system installed for a year, we see that April through to October the installation is producing more power than we are consuming, so we end up receiving credit from the City. Additionally, for the other part of the year, we are consuming much less power from the City and therefore paying much less. 

May 8, 2023.
Well, we're pretty much through the Covif pandemic ... only about 250 people dying of it in the USA every day!
 
So here, on the right, is a new version of the graph above that showed 2020 and 2021. This one shows data for four years, with 2023 (in green) only found for the first five months (Jan - May). 2021 (in red) is the first (left-most) bar for each year until the fifth cluster (for May) where it starts being preceded by 2020 (in orange) because May 2020 was the month in which the installation happened. 
Interestingly, 2022 had a heat-wave and this can be seen from July onwards that year!


TTFN

Friday, May 15, 2020

Chicken and Apples

Although you do get Chicken and Apple sausages in CostCo, among other places, it's a fairly unusual combination in America. There is a variety of ways of making it - this is just one that I tried this evening. It came out very well.
Here, for this recipe, I chopped three chicken breasts into medium sized pieces - I admit that it might have been better to have made the pieces smaller. Next time I'll try that and update things here.

Ingredients
Hasselblad Potatoes Two per person
Apples One medium per person
Chicken Breasts One per person
Rosemary Quite a bit!

Method
Preparation
Potatoes Before
  1. Cut the chicken into squares of a bit less than two inches.
  2. Put into a bowl with some olive oil and a good amount of Rosemary.
  3. Leave standing for at least 15 minutes while other things are prepared.
  4. Cut the apple into eighths and then half these width-wise. 
  5. If you're going to use celery too then chop this up and rince it well.


Potatoes
  1. Turn your oven on to 425F.
  2. Peel the potatoes and make sure that one side is good and flat so that the potato will not roll.
  3. Cut each potato with a series of vertical slices about 4 mm apart. The slices should go about 80% through the potato from top to almost the bottom.
  4. Place the potatoes onto a baking tray, brush them with olive oil, and douse when with some Rosemary.
  5. Cook at 425F for 30 minutes. Take out, spread gently with some butter, and replace back into the oven for another 30 minutes
Chicken
  1. About 10 minutes in to the potatoes second spell in the oven, heat some olive oil in a large pan and set some chopped onions to cook until translucent. 
  2. Peel the apples, section and core, and then chop up - probably eighths of an apple are a good size, unless you're dealing with very large or small ones.
  3. With Added Celery
  4. Add the apples to the oil and onions and, after a minute or two, add  the chicken pieces. 
  5. Chicken and Apple Cooking
    Chicken almost done

  6. Cook this mixture until the chicken pieces are well cooked through.
  7. I felt that some extra vegetables would be good, so chopped up 5 stalks of celery fairly finely and added them at the last moment. They got warm but not soft, which is unusual for celery.
  8. Take the potatoes out of the oven and brush them with some more butter.
  9. Plate the meal and present. You should get some satisfying ooohs and aaaahs !!


Bon Appetit ! 
TTFN

Monday, May 11, 2020

Shrimp and Rice

This is a pretty easy thing to make and fills you up well. On top of the basic Shrimp and Rice (and herbs and spices) I like to add some veggies. You can choose the vegetables you add to it from a wide selection. My personal choice is frozen sweet corn.
Cooking Shrimp

Ingredients:


1 cupRice
6 tbspButter
4 clovesMinced Garlic
1 lbShrimp, shelled and deveined 
1/4 cupParmesan Cheese
3 tbspMilk
2 tbspChopped Parsley
To TasteSalt and Pepper
GarnishParmesan Cheese
1/2 lbFrozen Corn Kernels

Method

Cooking Shrimp
  1. Prepare the rice. In my little rice cooker it will usually take about half an hour, so start it about 20 minutes before the rest.
  2. In a large skillet, melt butter over medium-heat.
  3. Add garlic and cook for 3 minutes, or until lightly browned, stirring very frequently. Do not let the garlic burn !
  4. Stir in the shrimp and cook for 2 minutes, or until they turn pink, stirring frequently.
  5. Add cooked rice to the skillet and mix until well combined.
  6. Add cheese, milk, parsley, corn, salt and pepper; mix and stir for 1 to 2 minutes, or until creamy and heated through.
  7. Remove from heat.
  8. Garnish with parmesan cheese.
  9. Serve.
    Ready to serve

Wednesday, March 18, 2020

A CDC Example


The idea of CDC is to capture the changes undergone by the data in a table in order to make use of those changes elsewhere. Very often this is to update a data warehouse with just the changes rather than completely refreshing it. This post is designed to lead you through a simple example so that you get a good feel of how to create and use CDC.
A word of warning before we start off - this is going to be a long one!

Create Your Environment


For this example we start by creating a new database and a new table.

1.     Create the database

create database NWM

2.     Make sure that the SQL Server Agent is running for the database instance

3.     Enable CDC for that new database

exec sys.sp_cdc_enable_db

4.     Check results

select name, is_cdc_enabled from sys.databases

5.     You will get a list of databases and an is_cdc_enabled

      flag. In the example shown the NWM database is enabled.


6.     Next, create a table to set up for CDC. The table must have a primary key. For convenience here we make it an identity field.
    create table nwm_cdc
( id int identity(1,1),
  field_1 varchar(32),
  field_2 varchar(32),
constraint [PK_nwm_cdc] primary key clustered ([id] asc) on [PRIMARY]
 )

7.     Add some data to the table:
    insert into nwm_cdc
    select 'one', 'ein'

8.     Check the list of CDC-enabled tables in the database. You will find that you are returned an empty dataset.
    select * from cdc.change_tables


Set up CDC for your table

In this section you prepare the data table where changes will cause CDC activity.

1.     Set up CDC for the table by running this system procedure:

exec sys.sp_cdc_enable_table  
      @source_schema = N'dbo',             --schema of table with data
      @source_name = N'nwm_cdc',           --name of table with data
      @role_name = null,                   --role of table owner (optional)
      @captured_column_list = N'id, Field_2',--Fields to capture when changed
      @capture_instance = null,            --Name of the CDC “capture instance”
      @filegroup_name = N'PRIMARY',         --filegroup to keep output in
      @supports_net_changes = 1            --1 = merge changes on the same field

2.     Re-run step 8 above. You will now get what you see below. Notice that many of the values are taken from the command in step 1 just above. 
           a.     source_object_id is the id of the table we referenced in step 8, as found in
the sys.databases view.
                                b.     object_id is the id of the capture_instance that we have just created
                                c.     schema_id is the id of the schema of the table we referenced in step 8, as found in
                                                                             the sys.schemas view.
                                d.     capture_instance is the name of the CDC setup that we have just created.
                                                                              There can be two per data table, and each must have a unique
                                                                               name – the default is the table’s own name with _cdc added.

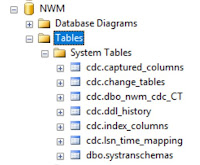
       3.     Now look at the System Tables branch under your database
               in the SSMS Object Explorer: 
               You will see that there are a number of tables with a schema
               cdc. The one that you have just made by performing step 1
               just above is cdc.dbo_nwm_cdc_CT, and this will collect the
               data generated by the CDC system whenever the table is 
               changed.


       4.     Now go further down in the Object Explorer and open up the SQL Server Agent tree.
              It should look like this (right). Two new jobs have been created in order to hold the code necessary
             
for processing the CDC operations.


Note     If you wish to disable CDC on a table then you use  sys.sp_cdc_disable_table, providing it the @source_schema, @source_name, and @capture_instance values to identify the Capture Instance.


Some Rules to Live By ?

Once upon a time I worked for this really cool company in Norway.

We had a company handbook, like everywhere, but this one started a little differently.

Work:You spend at least half of your waking time at work – get the most out of it!
Solutions:Do not choose the easiest solution; choose the one you think is right!
Work pressure:The reward is usually proportional to the difficulties.
Things you dislike:Do something about them; improve them if they are important enough.
Work instructions:Until you are certain someone else has taken over the responsibility, it is your own.
Colleagues:Find out which ones are important to you (organizational chart disregarded) and treat them accordingly.
Instincts:Be skeptical of some instincts, do some of the things you dislike the most, talk to some of the persons you dislike the most.
Performance:If you are honest with yourself, you are the best judge.
Improvements:You are allowed to propose improvements, even if you are not perfect yourself.
Obedience:If you are convinced that you are right, stick to it.
Personality:Be yourself. Like yourself. Improve yourself.
Mistakes:Admit them.
Chances:Take them


Monday, March 16, 2020

Moving to the Cloud.

Tech
No, this isn't going to be all about sneezing while making cake icing - sorry! It'll be about a project I was on recently and why this sort of thing, while time-consuming, really is worthwhile.

The company I was working with had a rather old Pick system completely custom-written for all customer-facing functions, newer warehouse controls, and a variety of reporting systems. They already had an on-premises SQL Server instance to provide an acceptable interface for all the reporting software, and the Pick Basic programmers had created the output software to fill it with data.

Their problem had been that the Pick system was becoming more demanding of maintenance in its old age, so they had decided to upgrade their whole system by replacing the Pick system with a Microsoft Dynamics 365 system, which, of course, lives in the cloud.

Happily, one of the features of the Dynamics system is that pretty much any entity within it can be set to export values every so may seconds (or minutes, ...) to an external instance of Azure SQL Database (named by default "BYOD" !!). The database records (stored in tables defined in the export) include indications of source, date, and time of creation. This allows the developer of an SSIS package on-premises to pull the data, transform it, and use it to update tables in a local SQL Server instance.

The transformation processes can, of course, include not just aggregation by time or by customer, supplier, warehouse, article, etc., but also the change of units - singles to dozens or kg to lbs and oz ! For example, Dynamics might record that 12 items were picked from the warehouse whereas the reporting systems might work in units of a dozen.

So, to convert to using the Dynamics system one must first connect it to the various electronic reporting systems from warehouses, etc. But .... connect it in such a way that what it produces in terms of data resulting from any specific event must be identical to that produced by the legacy system. This sounds simple, but that's as far as the simplicity goes!

So in mid 2018 Microsoft announced an add-on to Dynamics 365 called "BYOD". This would be an Azure SQL Database instance, running beside the Dynamics instance. Entities withing Dynamics could be modified to maintain tables in the BYOD with their values, updating at regular time intervals.
The result of this is that an on-prem system can be fitted with some SQL Server jobs written using SSIS and these jobs used to pull data from the BYOD database. The data can be pulled down, loaded into local staging tables, and then transformed into the formats expected by the programs running off the on-prem system. Once you've got all that designed, implemented, tested, and working then you're ready to move over from your old system to the new cloud one.
The key word here is designed - that includes determining all the pieces of data that the down-stream programs (reporting, etc.) need and then finding them in the new cloud data system. Once you've done that then the job is relatively simple, although tedious and needing a lot of patience.

[UPDATE] March, 2020; It looks like I'm going to be doing another similar project soon ... more info to come. Just keep away from CoViD-19 !!

Wednesday, February 05, 2020

A Drop In Poverty ?


The content of this post is something that a friend of mine posted on Facebook and which I do not want to lose. Facebook posts are notoriously good at vanishing, never to be found again.
The author goes by Debby Dootson on Facebook.


I took a big ol' hour and a half step-out while a certain someone was counting how many lies and half-truths they could pack into a speech, but thanks to social media I got to see this tidbit.
"Poverty is plummeting."
The poverty level is around $11,000 for a single person under 65 years in the US. The minimum wages in several states have been going up during the last 4 years due to state regulations being passed, which would bring even a part-time minimum wage worker over $11,000. Obviously the rate is going to go down. Nobody talks about the fact that the poverty rate is set INSANELY low, to a point where no one could survive in any part of America on that amount anyways unless they had someone else supporting them.
From the Census Bureau: "The official poverty rate in 2018 was 11.8 percent, down 0.5 percentage points from 12.3 percent in 2017. This is the fourth consecutive annual decline in poverty. Since 2014, the poverty rate has fallen 3.0 percentage points, from 14.8 percent to 11.8 percent."
Whoopty-fking-doo you managed to get it so over 10% of America still can't manage to make $11,000 a year. A 3 percentage point decrease in poverty. Let's see what the percentage point increase is in the top quintile's median income in the meantime, shall we? I'll just throw a chart in. People like them better and I think they have a bit more impact. Decide on your own. You have to look holistically to get the whole story.


In case you want to see the it in adjusted dollars, see below. This is a perfect example of numbers not telling the whole story. Someone could say to you: 
"The 4th quintile is reaping the largest benefits from Trump's tax plan! See? They saw a 5% increase while the top 5% of households only saw 2.5%!" 
Then you look at the numbers, and realize how much more 2% of $400,000 is than 5% of $35,000. Hmm.


Also notice that little dip on the top quintile? This is genius. It makes the powerful people with lots of money feel like they are losing out, so they will keep voting for policies that appear to support them while mainly benefiting only the highest echelon. We need to be taking notes for our next life just in case. This is brilliant. 
The upper class feels victimized by the policies and sees gains being made by the lower classes (which are minimal and largely token) and therefore ask for even lower taxes and less restrictions because GAWD can't you see the poor people are making more money and here we are stagnating when we work just as hard! 
God!, the longer I look at it the more genius it is. Look at that slope uptick on the top 5%. Royal scam.

I would just like to say that I am immensely grateful to have friends such as Debby. They make life so much easier to live.


Found Food

I have published quite a few recipes here on my blog over the last few years, and I hope that all my readers have tried at least some of the...